Custom Data Loading of GeoGraphix Projects Using SAS™ - Mid Continent Example
![]()
Contents:
| Project Summary | |
| Key Features |
![]()
Project Summary
The outgrowth of using GeoGraphix for exploration and production at DLB Oil & Gas, Inc. identified serious deficiencies in commercially available well data information. Project team members learned early on that some sort of pre-processing of the well data was needed to extract the maximum benefit from the data. This resulted in the development of a series of SAS routines that enhanced the usability commercially available well data for exploration. These routines were refined over a number of years with active consultation and collaboration with Mid-continent earth scientists who had a direct influence on the modifications. These modifications represent enhancements over the direct use of PI and Dwight's scout and production data.
![]()
Key Features
| The main problem with using GeoGraphix in the Mid-continent is the project size limitation. You cannot load all of the Mid-continent well data into one GeoGraphix project. Our solution was to divide up the Mid-continent data into quadrangles. Each quadrangle is 1° of latitude and 2° of longitude. There is a 5% overlap between quadrangles to allow mapping to the edge. Each quadrangle contains about 15,000 to 145,000 wells depending on location. This number of wells is just about right for using GeoGraphix. The entire Mid-continent (Kansas, Oklahoma, Texas Panhandle) can be loaded into 20 GeoGraphix project quadrangles with full detail. | |
| In addition to the GeoGraphix quadrangle projects, you can load a special regional Mid-continent project with data by selecting only the currently active wells from the production records. This project therefore contains all of the data in each of the quadrangle maps with respect to currently operating wells (HBP) only. This project was used for generating acquisition targets on a regional basis. | |
| Statistical analysis of the Mid-continent well data is possible by using SAS. SAS stands for Statistical Analysis System. You can generate reports on cumulative production ranked by formation. | |
| We use a 10 digit API number as the unique well identifier. This avoids the duplicate well spot problem that is encountered with using the 14 digit API number as the unique well identifier. The 10 digit API number locates the surface location and the borehole number is extracted from the 11-12 position in the 14 digit API number and is used to assign the borehole number in GeoGraphix. For example, there are 460,469 wells with 14 digit API numbers in Oklahoma, Arkansas, and the Texas Panhandle. When we use the 10 digit API number, the well count drops to 419,011 for a decrease of 9%. | |
| Formation names and ages are simplified and matched with the formation name file from Dwight's and/or PI production data. This results in a decrease of unique formation names in Oklahoma from 27,000 to about 1,700. The formation name file in the GeoGraphix project is alphabetized by nmonic. | |
 Producing formations are categorized by age code. A producing formation is
defined as having an official IP test from the scout information or as having production
from the production records. This age code is also added to every formation record in the
GeoGraphix project, i.e. IP records, production records, formation records, DST records,
perforation records, and core records. Producing formations are categorized by age code. A producing formation is
defined as having an official IP test from the scout information or as having production
from the production records. This age code is also added to every formation record in the
GeoGraphix project, i.e. IP records, production records, formation records, DST records,
perforation records, and core records. | |
| All wells are re-spotted using the township, range, section, and footage. This is needed to insure that the surface location is accurate with respect to the section lines in Oklahoma. | |
| The well status classification is simplified from the PI and/or Dwight's classification. This avoids having 30 or 40 different well classifications. | |
| Formation depth and net-pay records are generated from the IP records and the production records. The net-pay data is generated from the perforation records and is added to the net pay values in the formation records. All non-producing formation records are given a net-pay value of 0. This allows a quick-look isopach of the producing formation with the zero isopach line defined by the well data. | |
| The current operator from the Dwight's and/or PI production data is added to the production records in the GeoGraphix project. This allows filtering and spotting of well data based on the Dwight's and/or PI current operator data. The original operator of the well is retained in the well header record. This is useful for commission work and acquisition evaluations. The current well status is retained to highlight HBP wells. | |
| Additional data is extracted from the production records. This is added to the GeoGraphix project as: |
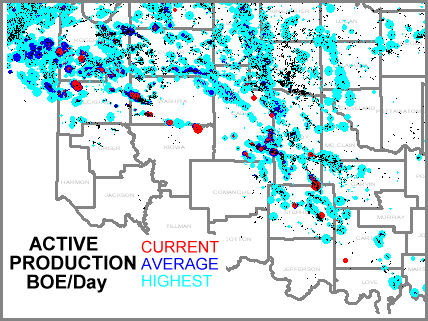
- Current production (BO/d and MCF/d), calculated from last month or last year production data. This is a measure of the current revenue value of the well.
- Average production (over life of well, BO/d and MCF/d), calculated as cumulative production divided by the number of days that the well was produced. This is a measure of reservoir quality.
- Estimated remaining reserves calculated from the current production using a 10% annual decline to a cut-off value of 1 BO/d or 25 MCF/d.
- Estimated ultimate recovery calculated by adding the current cumulative production data with the estimated remaining reserves.
- The Dwight's unique well identifier is added to the Alt. ID column in the GeoGraphix well header record. This allows direct access to the Dwight's production record from the Dwight's CD-ROM using the GeoGraphix system.
- Example bubble map showing highest initial production in light blue, average daily production over the life of the well in dark blue, and the current daily production (as of 9/1999).
| Bottom-hole location data is added to the GeoGraphix project by extracting the township, range, and section bottom-hole location data from the PI records. This data is spotted in GeoGraphix using the well spotting option. The lat-longs of the bottom-hole locations are exported and added to the GeoGraphix project as "N" class records for spotting the bottom-hole locations with respect to the surface locations. There are about 3,000 wells in Oklahoma with bottom-hole location data. | |
| Casing, tubing, liner, and DST data is added to the well comments section of the GeoGraphix project. | |
| Eliminate having a 0 (zero) value in the well datum record. | |
| Support of seismic operations by creation of custom loading files for the 3D workstations (Landmark, GeoQuest, Kingdom) from GeoGraphix projects. Several of the enhancements we were able to do involved the following: |
- Transfer well tops, deviation records, cultural data from GeoGraphix to 3D workstations.
- Transfer data from the 3D workstations to the GeoGraphix system.
- Convert depth-to-time and time-to-depth.
| Import data from corporation commission records in the form of first-reports and commission actions. | |
| Spot lease information by using GeoGraphix lease map module with a custom SAS routine from the company lease information systems. We create a LDF file for importing into the lease map module. | |
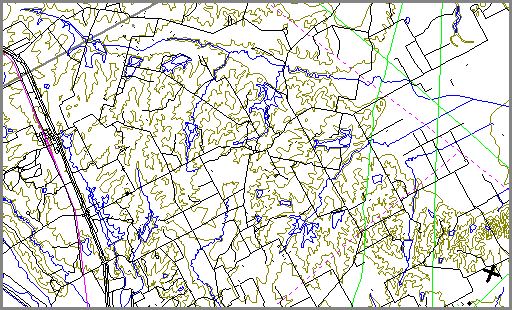
| Add county outlines for Oklahoma, Texas, Kansas, and Arkansas. In addition to the county lines, I have access to a series of datasets from the USGS that contain information from their Digital Line Graph (DLG) series. This data includes the following: |
- National park boundaries.
- Public land Section Lines.
- Hydrographic features (lakes, rivers, streams)
- Topographic contour lines (hypsography).
- Roads, trails, and railroads.
- Example map using USGS dlg data.
![]()