Geostatistical Trend Analysis (SE Oklahoma Example)
![]()
Contents:
| Project Summary | |
| Key Features |
![]()
Project Summary
SE Oklahoma Study, Twp 4S to 10S, Rng 3E to 12E, Oklahoma.
Cumulative production data and well penetrations of the Pennsylvanian, Mississippian, Hunton, Viola, Simpson, and Arbuckle in townships 4S to 10S and ranges 3E to 12E in Oklahoma were statistically analyzed. This was done to determine current exploration status in SE Oklahoma. The results are summarized as follows:
Table 1, Summary - Data from PI, Dwight’s, and GDS. Geometric Average of Fields and Wells by Geologic Age
Geologic Formation Zones |
*Total Penet- rations |
# of Fields |
Geometric Mean Field (BOE)** |
16th Field Percentile BOE |
Total Prod Wells |
Geometric Mean/well (BOE)** |
16th Well Percentile BOE |
| Pennsylvanian | 1,537 |
18 |
27,992 |
336,504 |
51 |
11,410 |
123,392 |
| Mississippian | 1,355 |
13 |
52,013 |
1,247,633 |
116 |
12,679 |
228,765 |
| Hunton | 1,238 |
8 |
66,845 |
864,015 |
55 |
5,187 |
172,067 |
| Viola | 1,228 |
18 |
109,284 |
1,410,508 |
116 |
26,275 |
215,814 |
| Simpson & Bromide | 1,089 |
12 |
151,888 |
3,588,186 |
138 |
28,775 |
207,219 |
| McLish | 879 |
12 |
124,624 |
2,515,784 |
57 |
38,136 |
477,878 |
| Oil Creek | 668 |
11 |
987,724 |
7,638,935 |
53 |
110,576 |
2,543,138 |
| Ouachita Facies | 468 |
5 |
5,637 |
65,247 |
8 |
4,542 |
37,084 |
| Arbuckle | 341 |
7 |
30,892 |
323,406 |
21 |
6,082 |
54,024 |
*Total Penetrations assume that a deep penetration also penetrated the shallower zones.
** Geometric means are valid in log-normal populations.
Methodology
A 45+ township area in SE Oklahoma(mainly Marshall and Bryan counties) was selected for analysis. Cumulative production data from Dwight’s and PI was selected from those townships and plotted on a cumulative probability graph by field (as identified by PI and Dwight’s) and individual wells.
The data was converted to barrel oil equivalency by the following formula:
1 Bbl Oil Equivalent = 6,000 CF gas.
![]()
Key Features
Analysis of Production Data
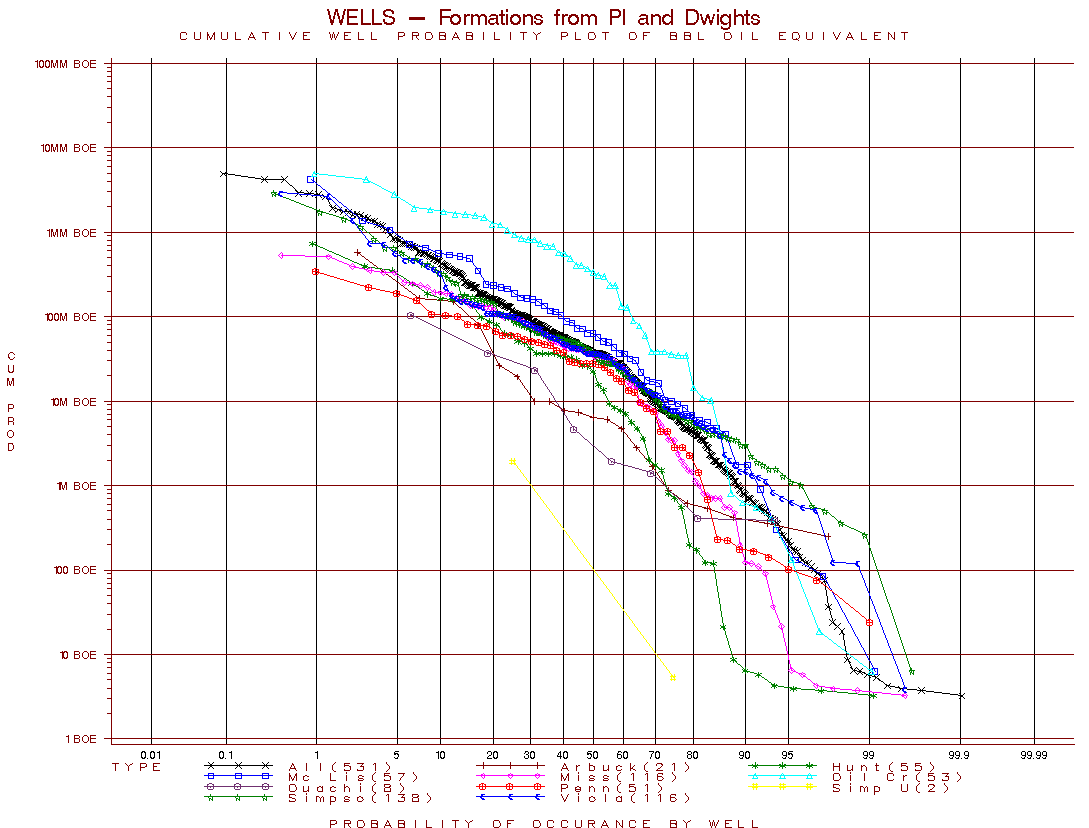
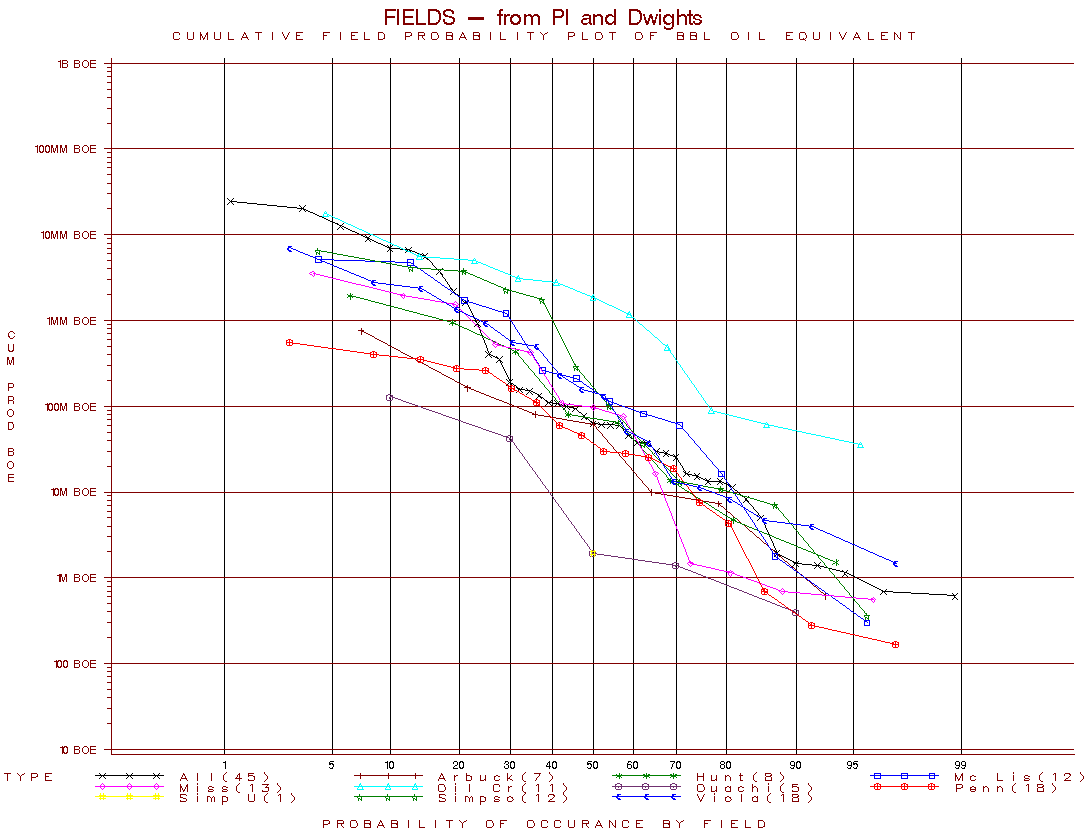
The data displayed on Figure 1 and 2, SE Oklahoma from Dwight’s and PI, define a log-normal distribution evidenced by the straight line on the logarithmic probability plot. Field size distribution is based on Dwight’s and PI field designations.
Figure 1, SE Oklahoma, Well cumulative production by formation.

Figure 2, SE Oklahoma, Field cumulative production by formation.

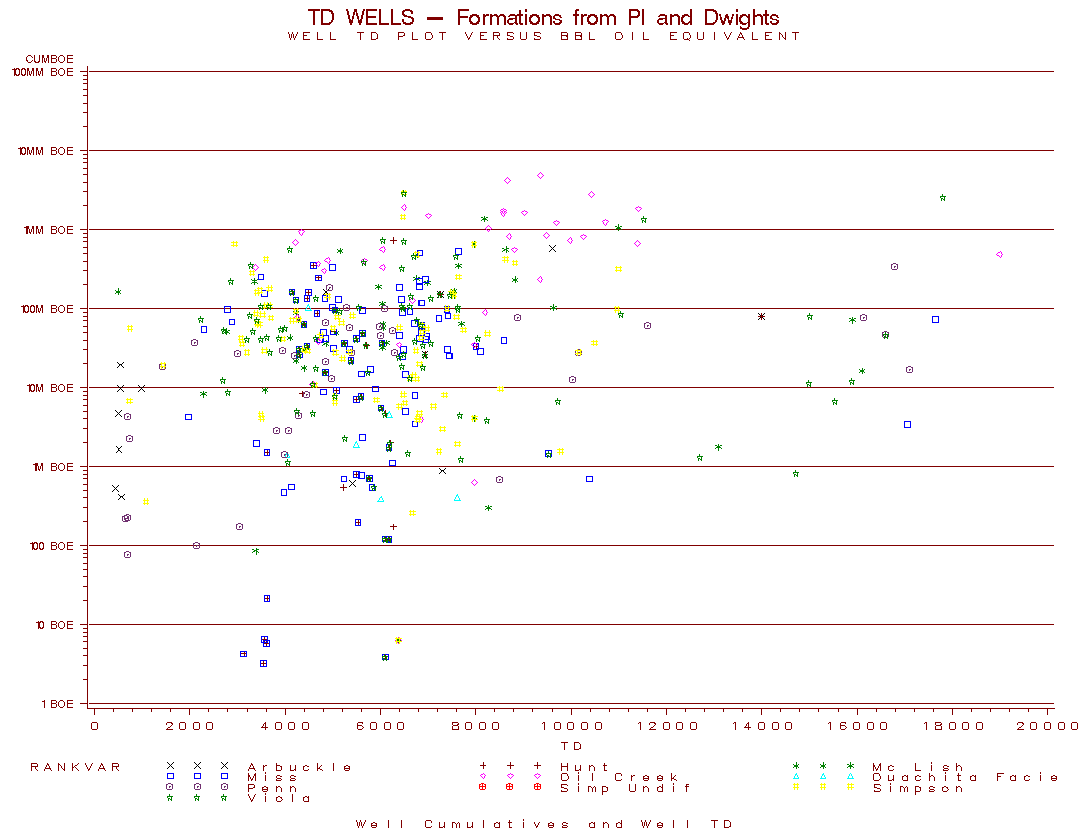
Figure 3, SE Oklahoma, Well cumulative production by formation and Total Depth.

Caveats
Total well penetration counts were generated by merging Dwight’s and GDS well tops with PI and Dwight’s production data by API number. Wells in GDS, Dwight’s, and PI without API numbers will increase the total well counts by counting a well twice.
Total well penetration counts depend on having data on tops, DST’s, cores, production tests, or formation at TD with marker information reported in each well in the study area. Each well without marker information or production will decrease the total well counts by one.
It is assumed that a well which penetrates a deeper horizon also penetrated all the shallower horizons.
Total productive wells depend on having an entry in the Dwight’s and PI production database. Wells which were plugged and abandoned prior to Dwight’s and PI recording the data (~1971) will decrease the total productive well count.
PI and Dwight’s field designations are generally in error. The field designations in Dwight’s and PI were synchronized to each other for field names. For example, Mustang North is the same as Mustang N in both datasets.
Production from commingled wells in the Dwight’s data were prorated by the number of commingled zones.
Production from PI was prorated back to the individual well by taking the total lease’s production and dividing by the number of wells that PI reported (by API number) on the lease. The cumulative production numbers will calculate higher for those leases which have incomplete well API number information and will decrease the total productive well count.
Production from Dwight’s was not prorated by the number of wells on a lease. This may give rise to anomalously high well production cumulative values and will decrease the total productive well count. The field cumulative production values (as reported) should be correct.
Active unitized water floods are generally counted as a single entity in both the PI and Dwight’s database. These, if present in the study area, will decrease the total productive well count.
![]()